406025: GYM102219 H Are You Safe?
Description
Recently, the nation was shocked by news of Sungai Kim Kim incident in Pasir Gudang, Johor, which has been polluted by chemical waste. Thousands of people who are affected had experienced nausea, dizziness and vomiting, and more than 100 schools were ordered to shut. In order to ensure that such incident will not happen again, an early warning system need o be developed so that residents can make early preparation, and authorities are able to move and act much faster.
A group of scientists has formed a committee to handle the incident, and a smart system with Internet of Things (IoT) sensors was suggested. Numerous sensors which can sense and monitor damages to the environment, either air or water, have been strategically installed around the state, and their coordinates are also recorded. However, the proposed system encountered a failure during its first testing phase. They want you to fix the problem in determining whether the given coordinates of sensors are safe or in the affected areas.
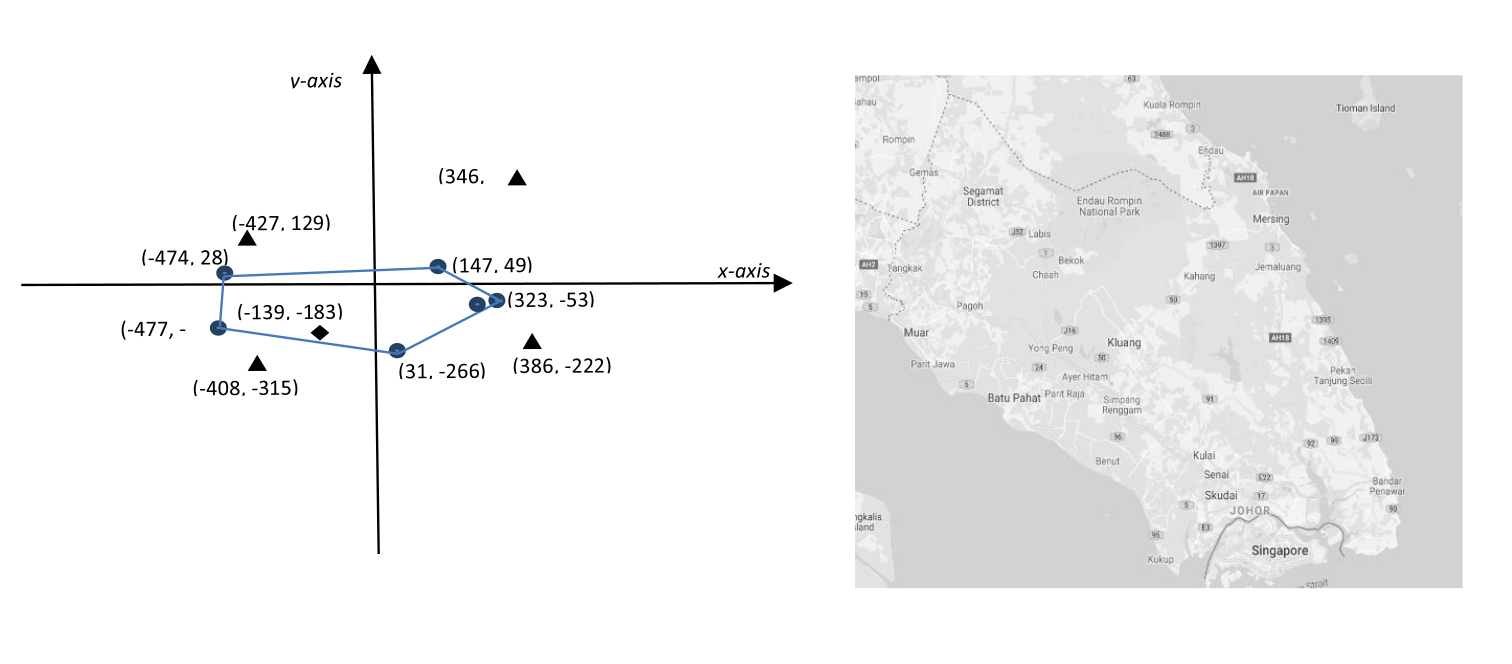
An affected area is defined as the polygon with the minimum length perimeter that can enclose all sensors that trigger warning signal within that area. For example, the sensors (represented by dots) of an affected area and its associated polygon, as well as safe (represented by triangles) and unsafe (represented by diamonds) points of the first dataset are illustrated below.
The input will contain records of data for several test cases of affected areas. The first line of each data set contains a non-negative integer $$$T$$$, the number of test cases $$$(1 ≤ T ≤ 50).$$$ Each test case starts with two non-negative integer $$$C$$$ and $$$P$$$ which is the number of coordinates $$$(3 ≤ C ≤ 50)$$$, and points $$$(1 ≤ P ≤ 50)$$$, respectively. The next $$$C$$$ lines contain coordinates (x-coordinate, y-coordinate) of each installed sensor, separated with blank spaces. The following $$$P$$$ lines contain coordinates (x-coordinate, y-coordinate) of certain locations in the state, separated with blank spaces. All coordinates are integers between $$$-500$$$ and $$$500$$$ inclusive.
OutputFor each test case, output the following item:
First line: The number of the test cases. The first record corresponds to $$$Case 1$$$, the second to $$$Case 2$$$ , etc.
Next line: A listing of all the points that appear on the perimeter of the affected area. The points must be identified in the standard form "x-coordinate y- coordinate". The listing must be oriented counter-clockwise and begin and end with the same point.
Last line: For each point of location in the data set, output the line:
$$$x-coordinate y-coordinate is status$$$
where $$$x-coordinate y-coordinate$$$ is the coordinate of the location from the input and $$$status$$$ is $$$'safe'$$$ or $$$'unsafe'$$$. A location is considered unsafe it is within the sensor perimeter. A point in exactly at the edge of the perimeter is considered safe.
Each test case must be separated by an empty line. See example.
ExampleInput2 6 5 -477 -180 31 -266 -474 28 147 49 323 -53 277 -79 346 488 -139 -183 -427 129 386 -222 -408 -315 5 2 -52 -325 104 420 315 356 -192 8 493 146 404 228 -239 484Output
Case 1
-477 -180
31 -266
323 -53
147 49
-474 28
-477 -180
346 488 is safe!
-139 -183 is unsafe!
-427 129 is safe!
386 -222 is safe!
-408 -315 is safe!

Case 2
-192 8
-52 -325
493 146
315 356
104 420
-192 8
404 228 is unsafe!
-239 484 is safe!